绘图
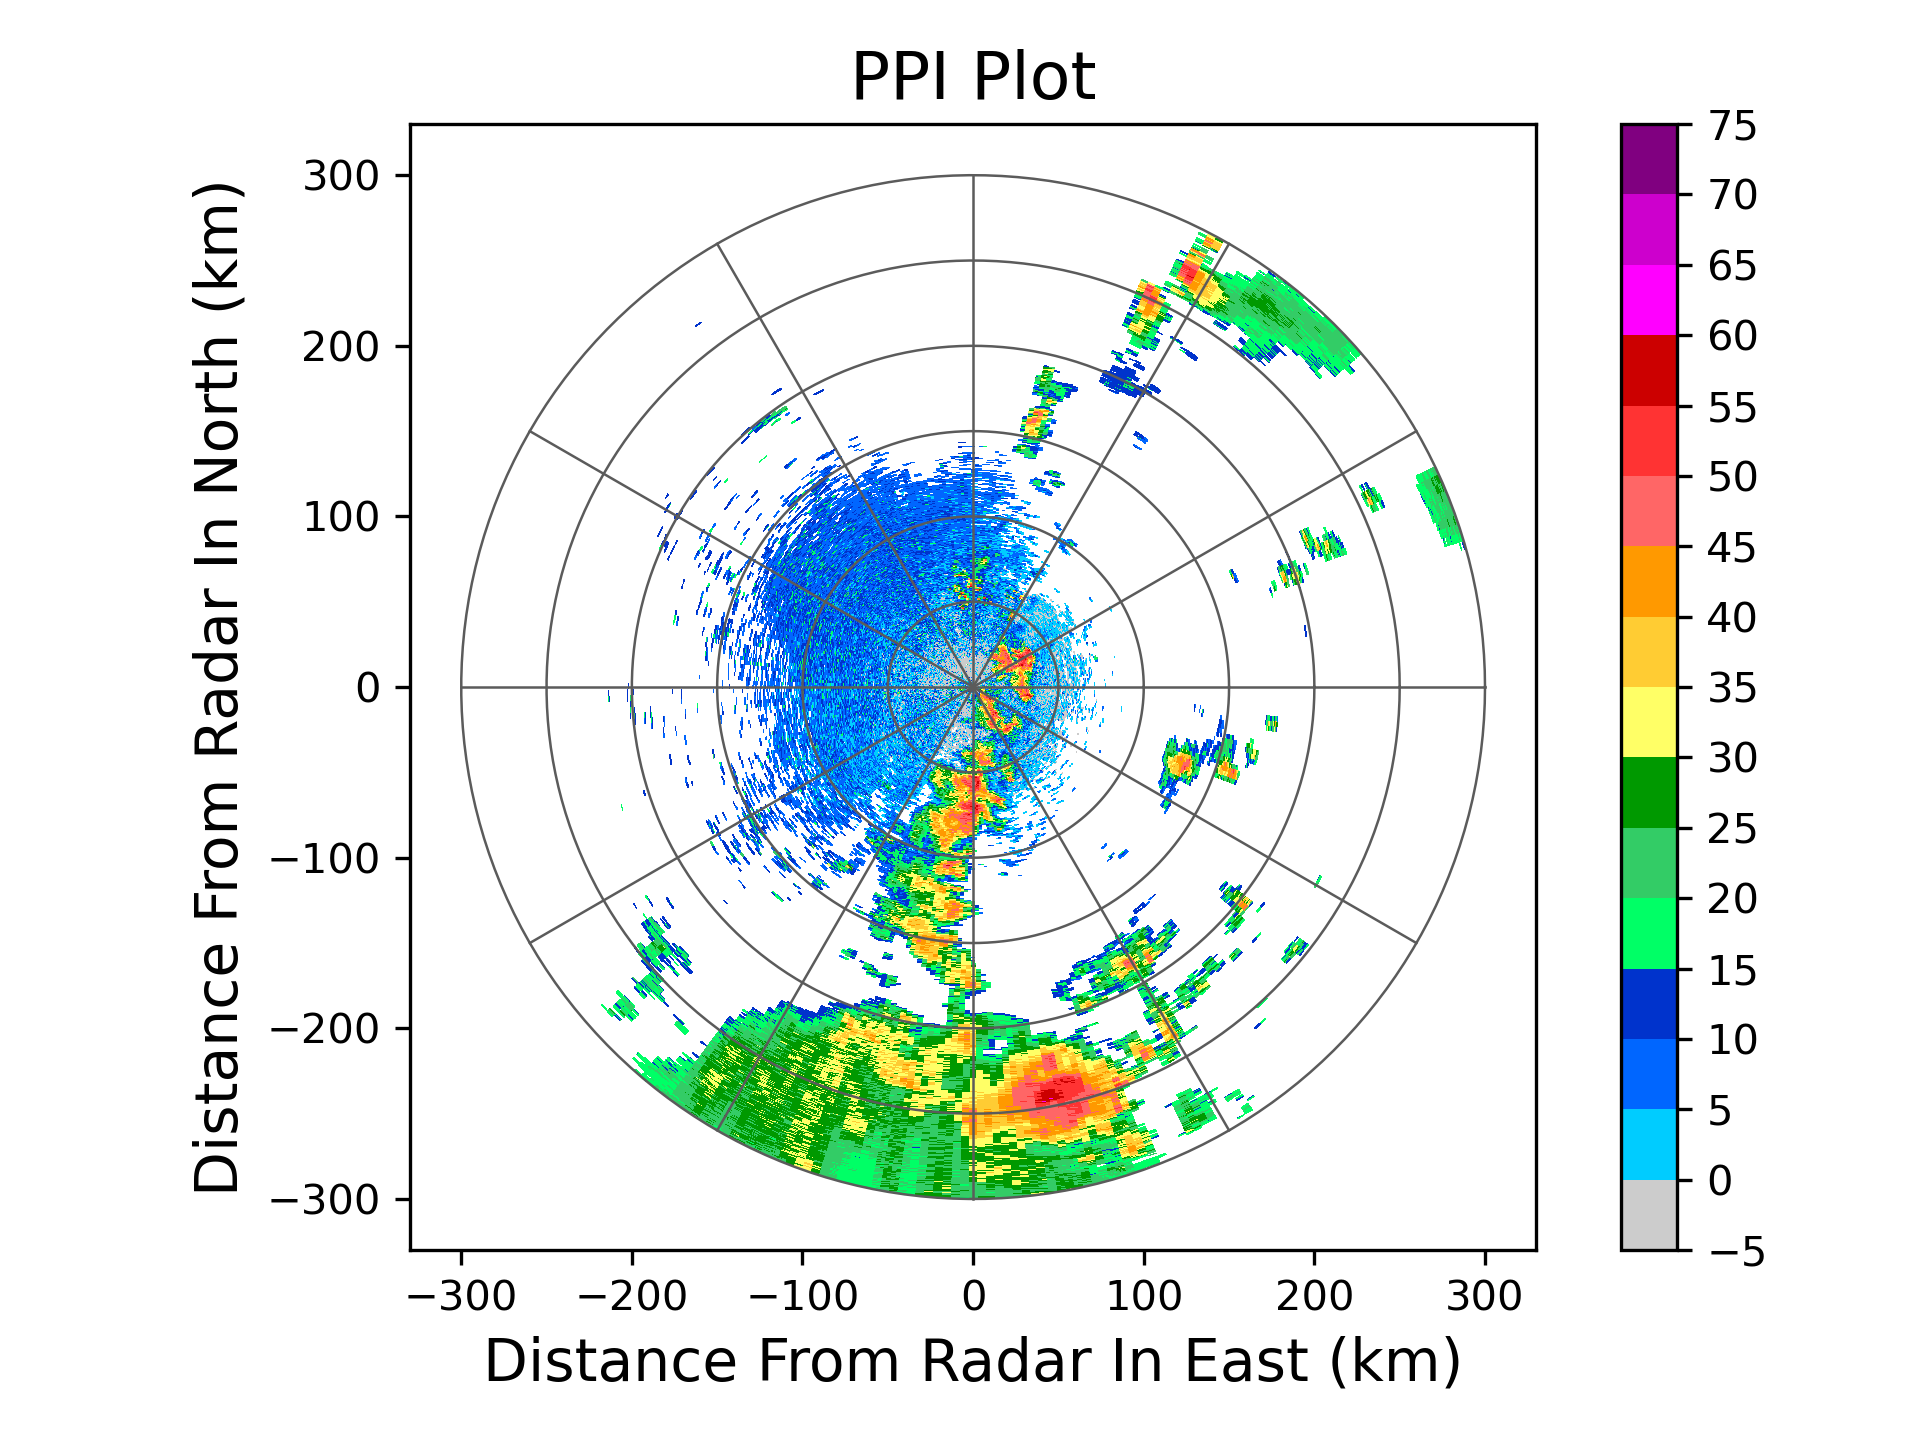
PPI绘图不叠加地图:
 1from pycwr.io import read_auto
 2import matplotlib.pyplot as plt
 3from pycwr.draw.RadarPlot import Graph
 4
 5filename = r"./data/Z_RADR_I_Z9898_20190828181529_O_DOR_SAD_CAP_FMT.bin.bz2"
 6PRD = read_auto(filename)
 7fig, ax = plt.subplots()
 8graph = Graph(PRD)
 9graph.plot_ppi(ax, 0, "dBZ", cmap="CN_ref") ## 0代表第一层, dBZ代表反射率产品
10graph.add_rings(ax, [0, 50, 100, 150, 200, 250, 300])
11ax.set_title("PPI Plot", fontsize=16)
12ax.set_xlabel("Distance From Radar In East (km)", fontsize=14)
13ax.set_ylabel("Distance From Radar In North (km)", fontsize=14)
14plt.show()

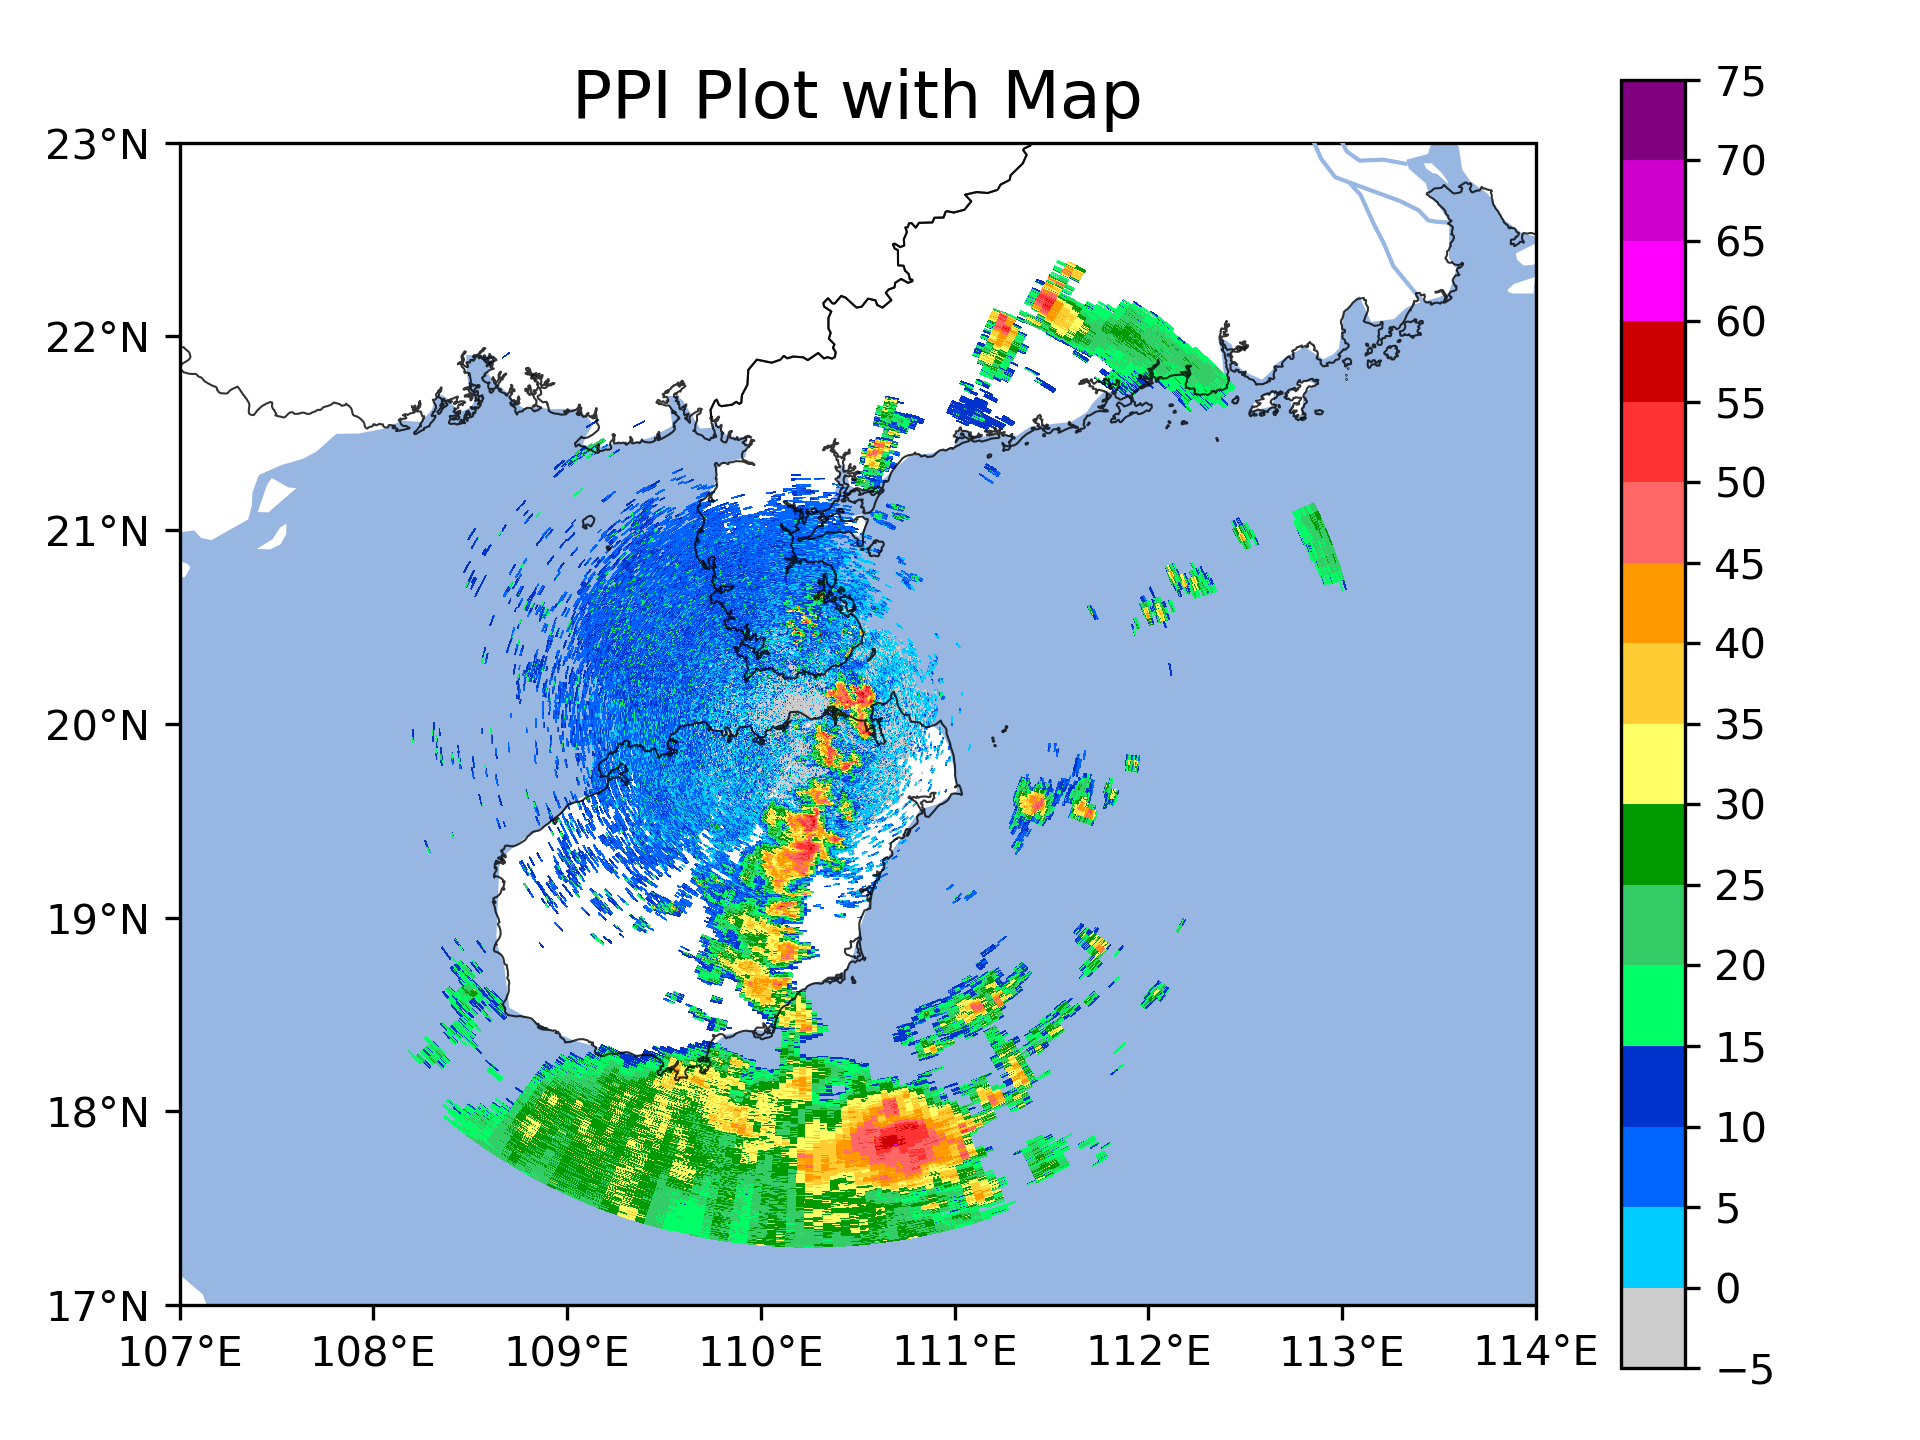
PPI绘图叠加地图:
 1from pycwr.io import read_auto
 2import matplotlib.pyplot as plt
 3from pycwr.draw.RadarPlot import GraphMap
 4import cartopy.crs as ccrs
 5filename = r"./data/Z_RADR_I_Z9898_20190828181529_O_DOR_SAD_CAP_FMT.bin.bz2"
 6PRD = read_auto(filename)
 7
 8ax = plt.axes(projection=ccrs.PlateCarree())
 9graph = GraphMap(PRD, ccrs.PlateCarree())
10graph.plot_ppi_map(ax, 0, "dBZ", cmap="CN_ref") ## 0代表第一层, dBZ代表反射率产品,cmap
11ax.set_title("PPI Plot with Map", fontsize=16)
12plt.tight_layout()
13plt.show()

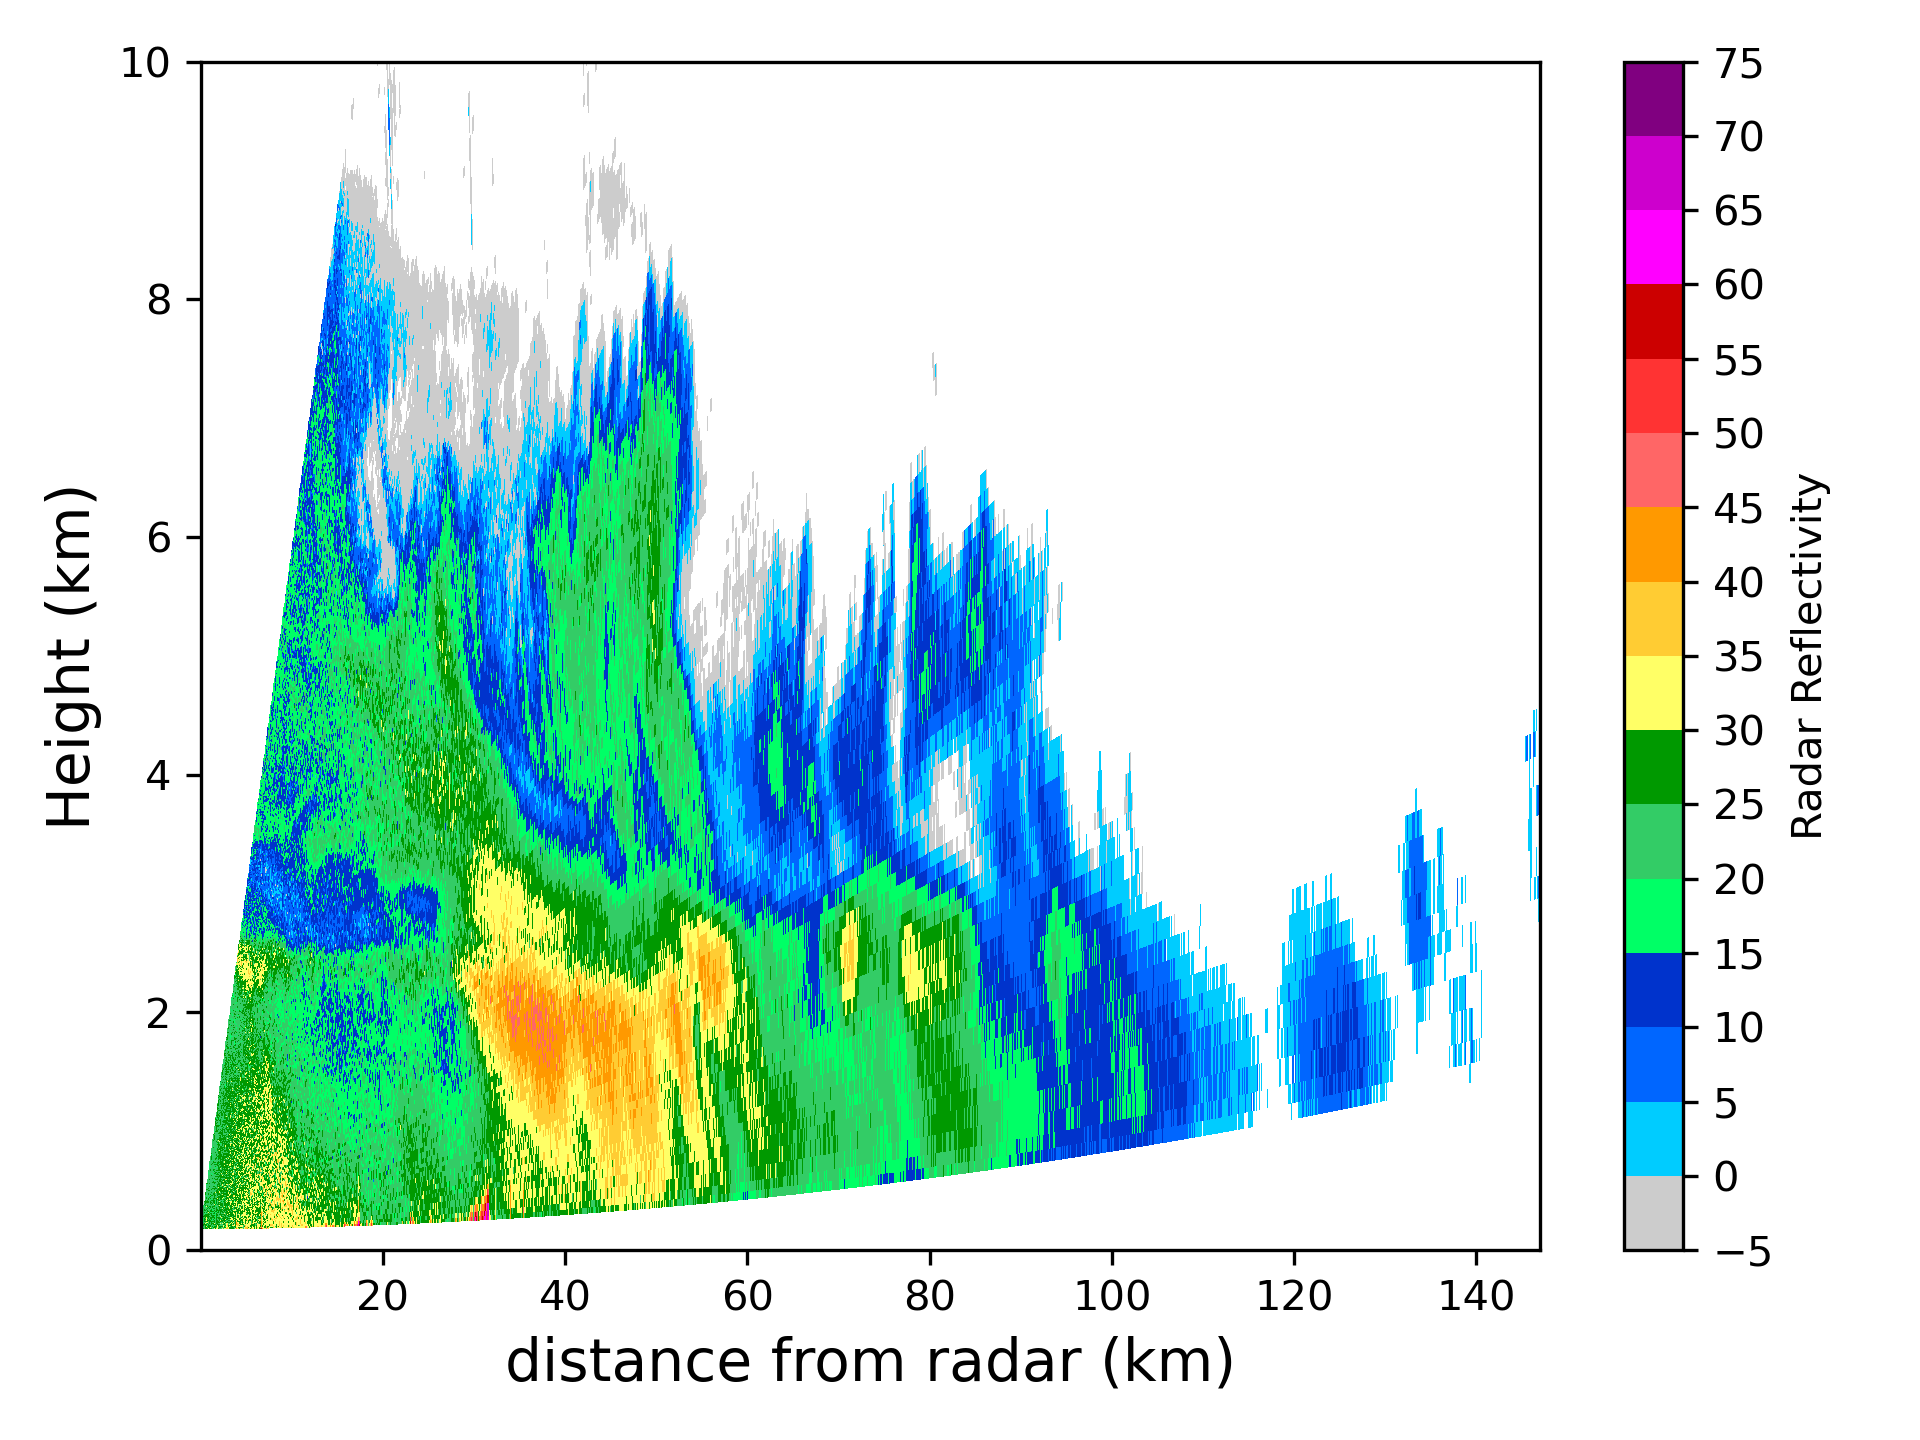
雷达RHI绘图:
 1from pycwr.io import read_auto
 2import matplotlib.pyplot as plt
 3from pycwr.draw.RadarPlot import Graph
 4
 5filename = r"./data/NUIST.20170323.142921.AR2"
 6PRD = read_auto(filename)
 7
 8fig, ax = plt.subplots()
 9graph = Graph(PRD)
10graph.plot_rhi(ax, 0, field_name="dBZ", cmap="CN_ref", clabel="Radar Reflectivity")
11ax.set_ylim([0, 10]) #设置rhi的高度范围 (units:km)
12ax.set_xlabel("distance from radar (km)", fontsize=14)
13ax.set_ylabel("Height (km)", fontsize=14)
14plt.tight_layout()
15plt.show()

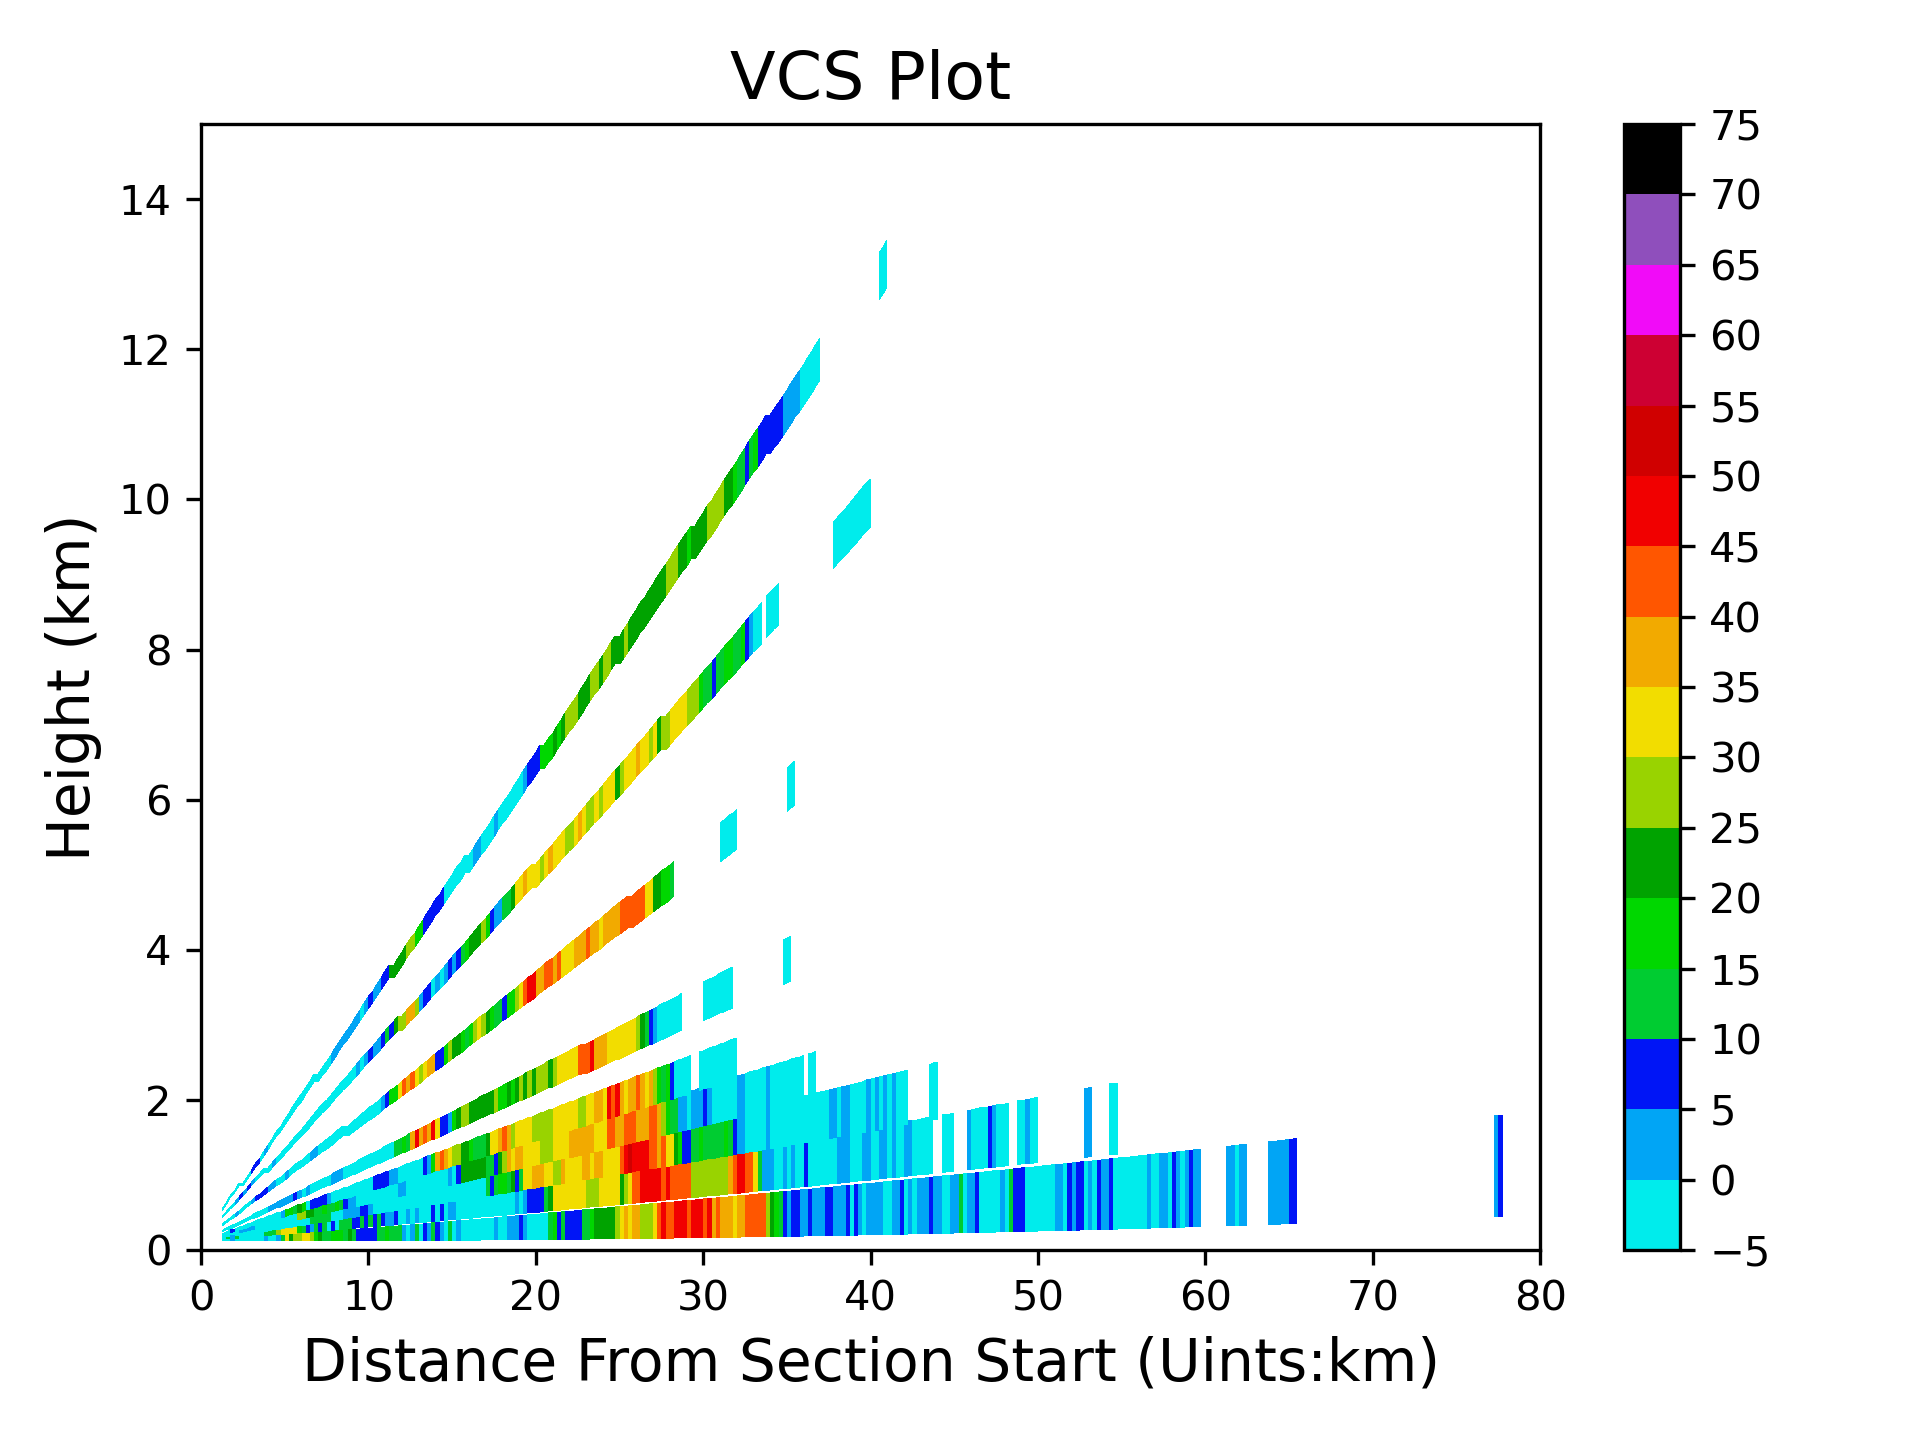
天气雷达剖面图:
 1from pycwr.io import read_auto
 2import matplotlib.pyplot as plt
 3from pycwr.draw.RadarPlot import Graph
 4
 5filename = r"./data/Z_RADR_I_Z9898_20190828181529_O_DOR_SAD_CAP_FMT.bin.bz2"
 6PRD = read_auto(filename)
 7
 8fig, ax = plt.subplots()
 9graph = Graph(PRD)
10graph.plot_vcs(ax, (0,0), (150, 0), "dBZ", cmap="copy_pyart_NWSRef") #起点,终点 (units: km)
11ax.set_ylim([0, 15])
12ax.set_xlim([0, 80])
13ax.set_ylabel("Height (km)", fontsize=14)
14ax.set_xlabel("Distance From Section Start (Uints:km)", fontsize=14)
15ax.set_title("VCS Plot", fontsize=16)
16plt.tight_layout()
17plt.show()
